AtGGM2014
(click here to download the program)
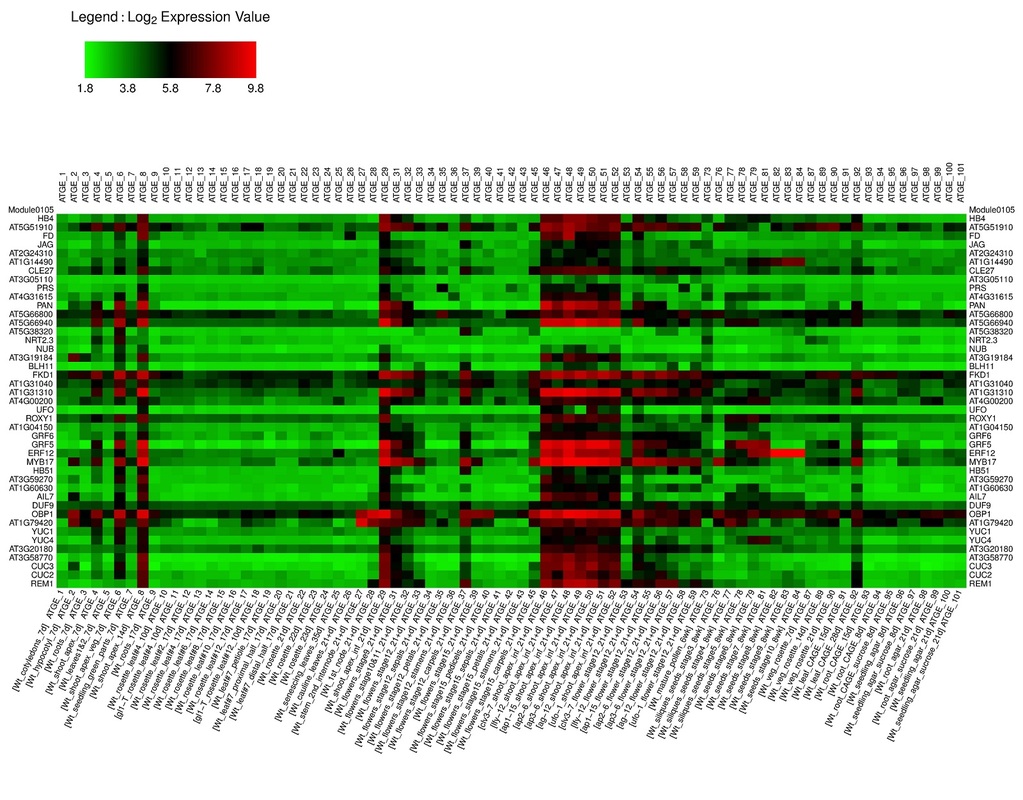
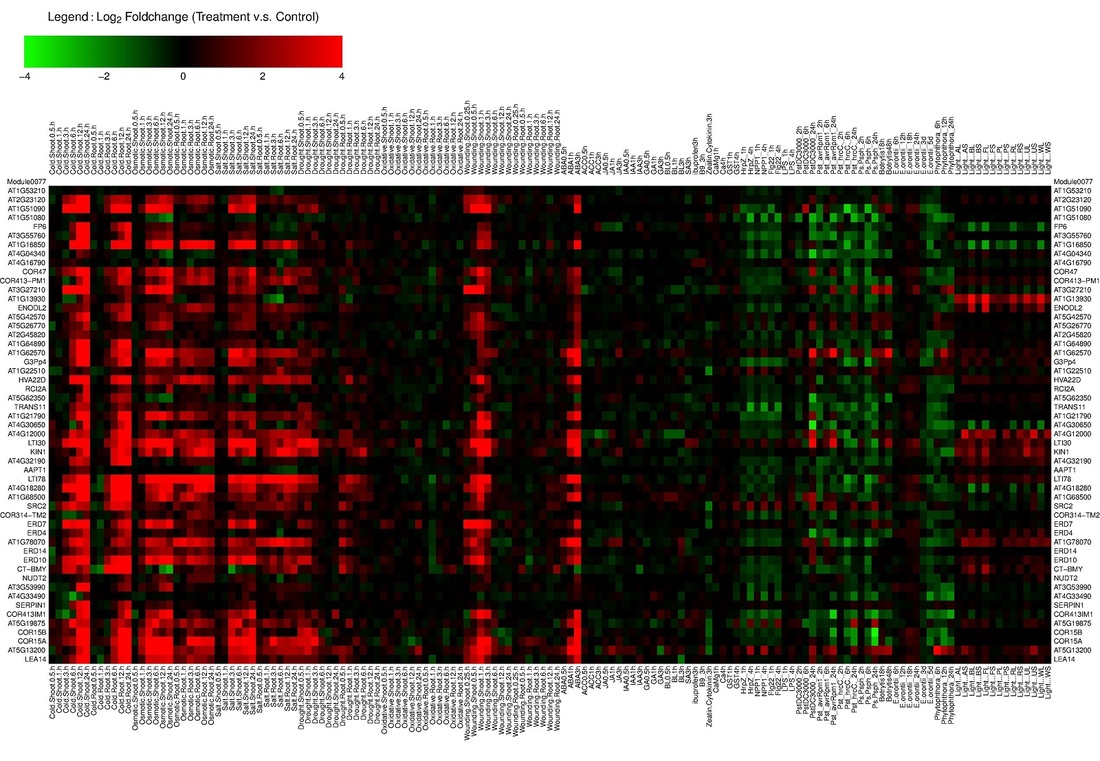
AtGGM2014 is a program to visualize the gene expression patterns of the gene modules identified from an Arabidopsis gene co-expression network (Ma et al, in press). The network, termed AtGGM2014, was constructed using the graphical Gaussian model (GGM). It contains 18,068 genes that organize into 662 gene co-expression modules. These modules function in a variety of plant developmental, hormone signaling, stress response, house-keeping, and metabolism pathways. The AtGGM2014 program generates heatmaps showing the expression of these modules in various tissues or their regulation under different stress or hormone treatments. The expression data were obtained from the AtGenExpress project. The module structures and their expression heatmaps provide extensive information to generate testable hypotheses that will facilitate further studies on the related pathways.
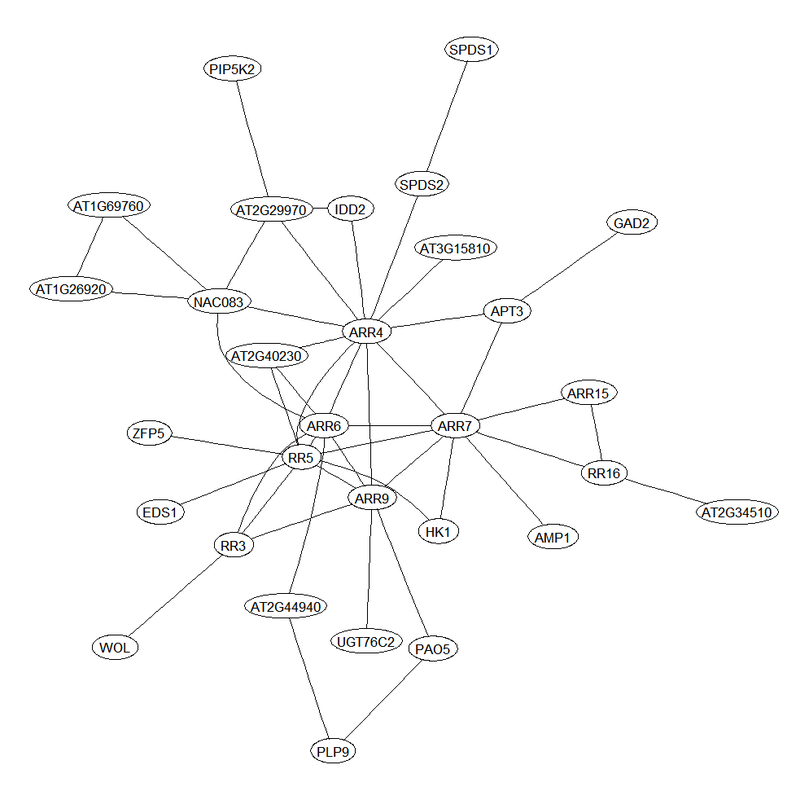
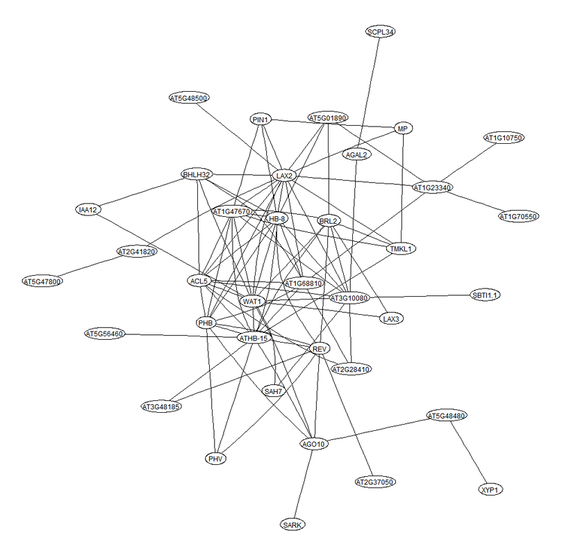
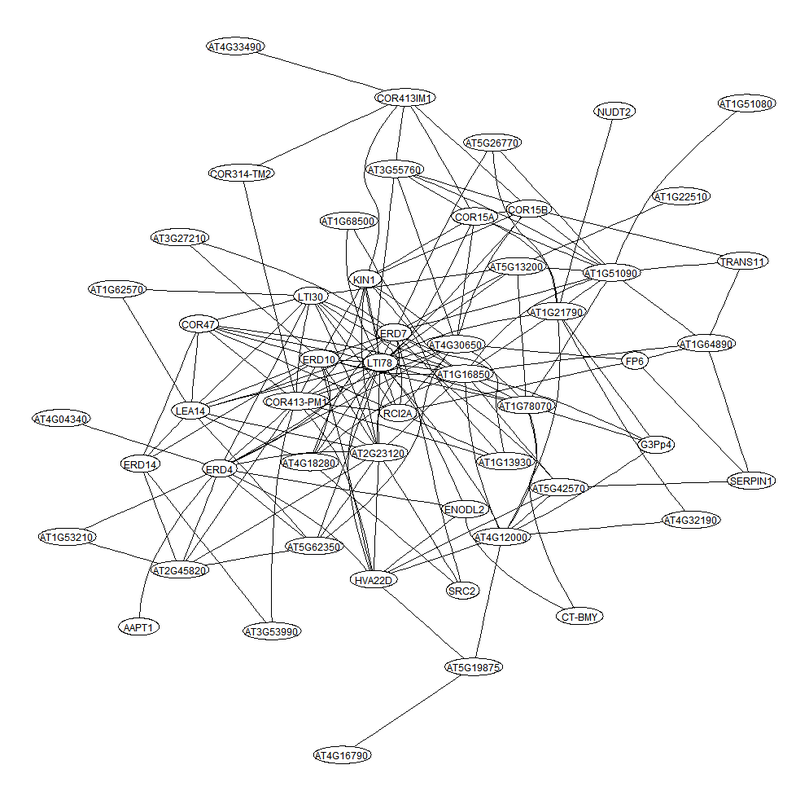
Additionally, The program can extract and visualize sub-networks for genes of a specific module or for genes connected with a gene of interest.
For more details of the AtGGM2014 gene network, please refer to this paper:
Ma S, Bohnert HJ, Dinesh-kumar SP. (2015) AtGGM2014, an Arabidopsis gene co-expression network for functional studies. SCIENCE CHINA Life Sciences, 58(3): 276-28 [Full Text]SCIENCE CHINA Life Sciences, 58(3): 276-28 [Full Text]
Examples of the heatmaps and gene sub-networks generated by the program.
Does the AtGGM2014 network contain my gene of interest?
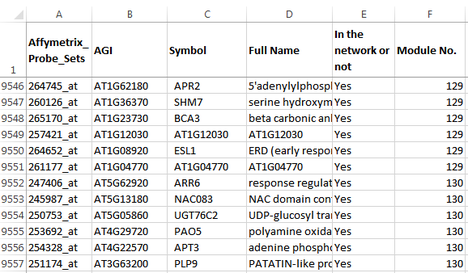
An EXCEL file is included in the program package, which lists the genes used in the network analysis, their module identities, and the Gene Ontology analysis results for all the modules. Use this file to check if a gene of interest is included in the network, and if so in which module is the gene located. The AtGGM2014 program can then be used to visualize the expression patterns of that module.
Below are two snapshots of the EXCEL sheet.
(click here to download the program)
Reference
Ma S, Bohnert HJ, Dinesh-kumar SP. (2015) AtGGM2014, an Arabidopsis gene co-expression network for functional studies. SCIENCE CHINA Life Sciences, 58(3): 276-28 [Full Text]
Ma S, Shah S, Bohnert HJ, Snyder M and Dinesh-Kumar SP. (2013) Incorporating motif analysis into gene co-expression networks reveals novel modular expression pattern and new signaling pathways. PLoS Genetics 9(10):e1003840
